2010-05-19 1100: Yesterday was the 30th anniversary of the eruption of Mount St. Helens. I had the privilege of seeing this happen. The eruption happened after a month or two of preliminary minor eruptions ("throat clearing"); I remember friends and I trying to find out if it would be possible to go into the St. Helens wilderness to see any volcanic activity. Cold, rainy weather and the lack of a car prevented us from doing that. But the main event happened on a Sunday morning a couple of weeks after classes ended in my junior year at Reed College, a pleasant day in Portland that began cloudy but became sunny in the afternoon. The eruption was at about 8 in the morning, but we didn't know it in Portland at first—remarkably, since the explosion that began the eruption was audible hundreds of miles away but not in Portland. (Portland is 60 miles from the mountain, but apparently, the sound skipped over Portland.) But soon we were aware of the events as they unfolded, due to the continuous news coverage on TV. The eruption lasted nine hours, and produced a volcanic plume that reached as high as 15 miles above the ground. At first, in Beaverton (a southwest suburb of Portland), we couldn't see the eruption due to the clouds, but it cleared in the afternoon, and we could see the plume. (We couldn't see the mountain itself, hidden behind the nearby West Hills of Portland.) This was awesome; it looked like a huge thunderhead, but it was a brownish grey color. You could see lightning in the plume. The wind was from the west, and you could see the plume extend eastward from the volcano as a darkness of vast but indefinite extent. This was an ashfall of several inches that fell many miles east of the volcano. (The town of Yakima, in south central Washington, experienced this as pitch blackness, thunder and lightening, and falling ash. They had no warning and didn't know what was going on at first; it was a terrifying experience.)
Portland didn't get any ashfall in that eruption. But there were several subsequent big eruptions, and that summer one of these deposited an inch or more of ash. I missed that ashfall, but I saw ash caked in gutters or curbs when I was back in Portland later in the summer. The ash was of the consistency of fine sand; it seemed heavy. But I was in Portland late in the summer when a light ashfall occurred, it was like fine, grainy snow as it fell. I also got better views of the mountain in eruption later that year; I discovered the roof of the Physics building afforded a fine view of the mountain, and later, a window in the Library tower that also gave a good view.
About a year ago, a colleague surprised me with an odd souvenir: a peanut butter jar filled with Mount St. Helens ash. He gave this to me with the explanation that this was from family back west, and they didn't want it. I was grateful to take it off his hands. I wasn't in Portland for the heavier ash fall early that summer, and I always regretted not being able to collect some ash for posterity. I suspect there are more than a few peanut butter jars filled with ash in Portland attics. One souvenir that was popular at the time were "ash trays," made from glass produced by melting the ash. I'm not sure I want one of those.
2010-05-14 1845: I had quite an adventure the last two days, trying to accomplish a simple task: Get and read earthquake seismic data. I'm hoping to be able to do research on Mount St. Helens seismic data (from the slow eruption that began in October, 2004), and of course I need to be able to get and read the data to do that research.
Albyn Jones pointed me in the right direction; he gave me links with instructions and tools for getting and reading the data. The process turns out to be fairly straightforward: You look through a certain database online to figure out what data is available. Then you then use that information to compose a correctly-formatted email to a data server, which replies to your request with a message giving a link or address containing the data for you to download. Finally, you use a special program ("rdseed") to read the data file and convert it into a form that's easy to read or use. (The data file format is called SEED, Standard for the Exchange of Earthquake Data; it's an international standard.)
All of this took some figuring out. But the last step was a trial. My computer is a Windows machine, but the special program "rdseed" is not available for Windows—only for Unix, Linux or Macintosh. However, they do have a version of the program, "Jrdseed", for Windows. But this was a trap, because after spending quite a while figuring out how to download and run the program, I finally learned it cannot perform the particular file conversion I needed. So I had to get access to a Unix or Linux system. It turns out I could get an account on an Indiana University supercomputer called Quarry; this runs on Linux, and I was able to do my file conversion successfully. (This is a rather trivial use of so much computational horsepower--Quarry is a seven teraflop system!)
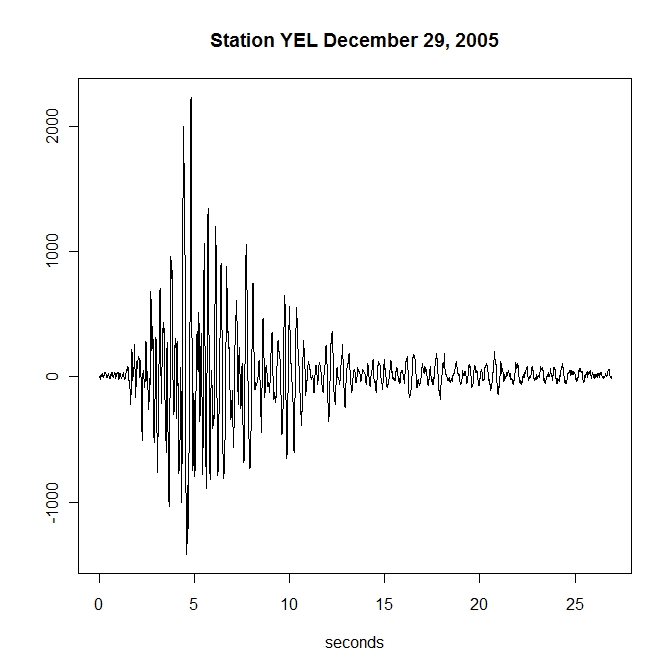
Anyway, here's the result of my labor: A plot of about 27 seconds of earthquake data. (This is a little bit of data from the file I downloaded, which represented about 3 hours of data.) This plot is from a seismometer station named "Yellow Rock", which is on the north side of Mount St. Helens, in front of the crater. It shows vertical ground motion (I don't know what the units are on the y-axis; some multiple of meters per second). This earthquake is one of millions of small earthquakes that occurred during the eruption.
2010-05-14 1230: National Public Radio and the New York Times are reporting on outside experts who have arrived at much higher estimates of the flow rate in the Deepwater Horizon oil disaster—ten times the early estimate of 5,000 barrels a day. Steven Wereley, an engineering professor at Purdue University, used particle image velocimetry to measure the flow rate of the material from the riser pipe shown in the video BP released this week. He concludes the amount of oil is approximately 70,000 barrels a day, but it isn't clear what fraction of the material is methane and what fraction is oil. One detail I had wrong in my estimate below is the diameter of the pipe: 21 inches, not 12 inches. (I'm not sure if I misread the number or if the news story I read the smaller number. BP claims the pipe with the actual leak is only 9 inches in diameter, but Prof. Wereley says this would not affect his analysis.)
(The NPR story: Gulf Spill May Far Exceed Initial Estimates. The NY Times story: Size of Oil Spill Underestimated, Scientists Say. The latter story reports that scientists are critizing BP for not using appropriate methods to measure the leak.)
A diarist on DailyKos linked to a particularly ominous story on the National Geographic web site: Gulf Oil Leaks Could Gush for Years. One of the experts they quote is Matthew Simmons, a well-known proponent of the "peak oil" theory who is a prominent investment banker for the energy industry; he is skeptical BP will be able to stop the leak before the oil reservoir is empty, which would take many months and put tens of millions of barrels of oil in the Gulf.
2010-05-13 1100: BP finally released video of one of the leaks in the Deepwater Horizon oil disaster. This shows a pipe on the seafloor spewing a cloud of oil mixed with natural gas. BP was under pressure to release this footage, because it would allow outside people to produce estimates of the rate oil is leaking; previous estimates were based on the size of the oil slick and sheen visible in satellite imagery. BP originally estimated it was leaking at the rate of 5,000 barrels a day (210,000 gallons a day), but outside estimates say it may be five times greater.
So I looked at the video, to try my hand at estimating the flow rate. The pipe shown in the video happens to be 12 inches in diameter, and the material flowing out of the pipe appears to be traveling at a speed of something like 5 or 10 feet per second. This implies a flow rate of something like 5 cubic feet per second, or something like 35 or 40 gallons per second. (One cubic foot is 7.48 gallons.) This in turn would be about 650,000 gallons per day, which is about 15,000 barrels a day. This suggests the flow rate is 3 times what BP estimated. But the material flowing from the pipe is not all oil; the material fluctuates from light to dark in the 30 seconds of activity shown. So perhaps the BP estimate of 5,000 barrels a day is reasonable. But we can see that it's about this order of magnitude from the video. (BP is presumably under pressure to produce a low estimate, to diminish the magnitude of the disaster. But I expect how severe this disaster is perceived to be will depend on its visible effects on shorelines in the Gulf. So far there have been no dramatic "black tides" on beaches.)
2010-05-01 2230: In my previous post (2010-04-27 2230), I commented on how solutions to our serious environmental and energy problems appear to be obstructed by the fossil fuel industry. Since my posting, the deep sea oil rig disaster near the Louisiana coast threatens to reach catastrophic proportions; some experts are saying that the amount of oil being released is much greater than the 5,000 barrels (210,000 gallons) per day estimated by BP and the government—it may be an underwater oil gusher. The threat is that this release may continue for months before the leak is stopped or the oil field has been completely drained. If this happens, the release of oil would be an order of magnitude greater than the Exxon Valdez (which was 11 million gallons). The oil may poison the extraordinarily rich wetlands of Louisiana, and it is possible that the oil will circulate around to the Florida Keys, site of the only coral reefs in North America. It is also possible that the oil will than travel up the Eastern seaboard.
I hope and pray that these horrific scenarios do not come to pass; I pray for the engineers and workers who are preparing to stop the leak. (I read a news report to the effect that they are preparing to lower a large container over the well head, which will capture the oil and enable it to be safely pumped to the surface.)
Added 2010-05-04 0730: A hopeful New York Times news analysis, Gulf Oil Spill Is Bad, but How Bad?, by John Broder and Tom Zeller gives reasons why the disaster might not be as severe as feared.